The Bell Curve form plays a pivotal role in educational assessments, particularly in relation to understanding a child’s abilities compared to their peers. It utilizes the concept of standard scores, standard deviations, and percentile ranks, which are essential for interpreting results from various testing instruments, such as the Wechsler IQ tests. Standard scores generally have a mean of 100 and a standard deviation of 15, meaning that a standard score of 115 indicates a performance above average, specifically at the 84th percentile. This form helps in distinguishing between a child’s academic achievements and their potential, revealing insights into whether a child is progressing, plateauing, or lagging behind in relation to their cognitive abilities. For example, if a child demonstrates a standard score of 85 in written language, this indicates a performance at the 16th percentile, highlighting areas of concern when compared to their overall IQ of 110 at the 75th percentile. The Bell Curve also emphasizes that half of all children score between the 25th and 75th percentiles, providing a clear framework for interpreting academic performance in a meaningful context. Additionally, terms like Stanine scores and T scores offer simplified ways to convey standard scores, ensuring that the complexity inherent in testing does not obscure crucial information about a child's educational standing. Understanding these elements will empower parents, educators, and specialists to make informed decisions regarding educational interventions and support systems.
| Fact Name | Description |
|---|---|
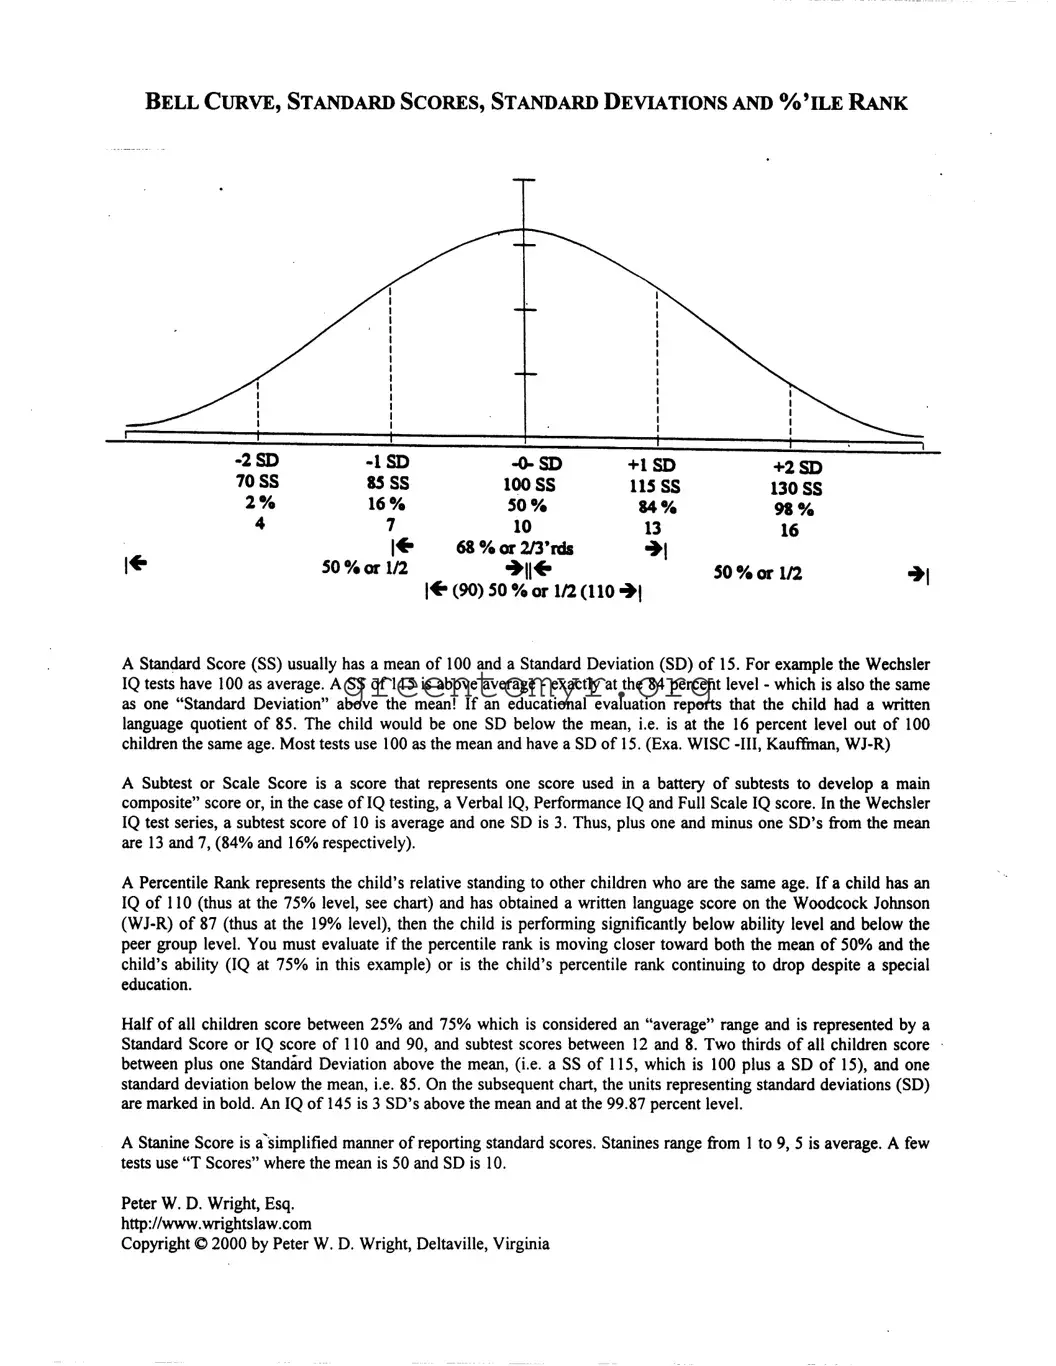
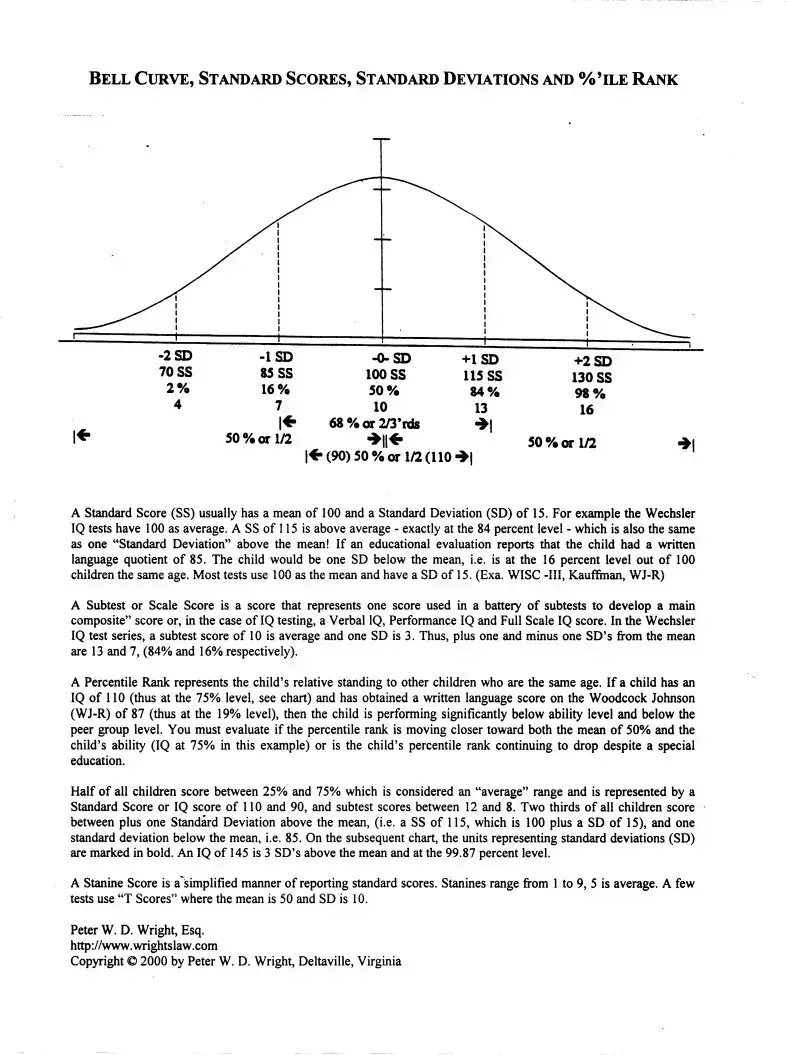
| Standard Score Definition | A Standard Score (SS) typically has a mean of 100 and a standard deviation of 15. For instance, in Wechsler IQ tests, 100 is the average score. |
| Standard Deviations | A score of 115 indicates one standard deviation above the mean, placing an individual at approximately the 84th percentile. Conversely, a score of 85 indicates one standard deviation below the mean, corresponding to the 16th percentile. |
| Subtest Score | In tests such as the Wechsler series, a subtest score of 10 is seen as average, with standard deviations being represented as plus or minus 3. |
| Percentile Rank Significance | The percentile rank of a child indicates their position relative to peers of the same age. For example, an IQ of 110 is at the 75th percentile, while a written language score of 87 places the child at the 19th percentile. |
| Average Score Range | Half of all children score between the 25th and 75th percentiles, which corresponds to a Standard Score of between 90 and 110 and subtest scores ranging from 8 to 12. |
| Stanine Score | Stanine Scores simplify reporting standard scores, ranging from 1 to 9, with 5 being the average score. |
Once you have gathered all necessary information, it's time to fill out the Bell Curve form accurately. This form will help you assess standard scores and their corresponding percentiles. Follow the steps below to complete it effectively.
A Standard Score (SS) is a statistical measure that indicates how far a particular score is from the average score in a distribution. Typically, a Standard Score has a mean of 100 and a Standard Deviation (SD) of 15. This means that most scores cluster around 100, with around two-thirds of scores falling between 85 and 115. For example, if a child's standard score is 115, it indicates that the child performed better than 84% of peers, as it represents one standard deviation above the mean.
A Percentile Rank provides insight into a child's performance in comparison to others of the same age. If a child's score falls at the 50th percentile, it means the child performed better than 50% of peers. In practical terms, a child scoring at the 19th percentile, for instance, is performing significantly below the average performance level. It is crucial to monitor whether the child’s percentile rank is improving or declining over time, as this can reflect changes in learning and development.
Standard Deviations are a key component in understanding the distribution of scores. Each Standard Deviation measures the extent to which a score deviates from the mean. In a typical distribution, scores within one standard deviation of the mean (between 85 and 115) are considered average. Approximately 68% of all scores fall within this range, while scores outside this range indicate below or above-average performance. For instance, a score of 145 denotes three standard deviations above the mean, placing the child at a very high performance level, specifically at the 99.87 percentile.
Subtest or Scale Scores represent scores derived from individual components of a larger testing framework. In IQ testing, for instance, tests such as the Wechsler scales grant Subtest Scores that contribute to overall composite scores, which include Verbal IQ, Performance IQ, and Full Scale IQ scores. A Subtest Score of 10 is viewed as average, with scores ranging from 7 to 13 illustrating relative performance levels. Understanding these scores helps identify specific strengths and weaknesses in a child’s cognitive abilities.
A Stanine Score offers a simplified method of reporting Standard Scores. It divides scores into nine categories, or "stanines," with 5 representing an average performance level. The use of Stanine Scores can help educators and parents quickly comprehend a child’s standing without delving into detailed statistical metrics. For instance, a Stanine Score of 3 would suggest below-average performance, while a score of 7 would indicate above-average capabilities.
Completing the Bell Curve form presents several challenges that can lead to inaccuracies. One common mistake occurs when individuals fail to understand the significance of standard deviations in relation to the scores. If users overlook that a mean score of 100 and a standard deviation of 15 are standard for most tests, they may misinterpret their child's performance. For instance, a score of 85 is one standard deviation below the mean, indicating a significantly different standing than intended.
Another mistake stems from incorrectly interpreting the percentile rank. People often assume that a higher percentile correlates directly with better performance without considering the context. For example, a child with an IQ of 110 at the 75th percentile may seem strong, but a written language score of 87 at the 19th percentile reveals that their overall performance is lagging, which goes unnoticed due to a lack of comparative analysis.
Inaccurate calculations of subtest scores also hinder proper understanding. The Bell Curve form outlines the average subtest score as 10, with a standard deviation of 3. Failing to note these benchmarks can lead to the erroneous categorization of scores. For instance, a subtest score of 8 may be interpreted as hopelessly below average without acknowledging it is one standard deviation below.
Some people mislabel the Stanine score, which simplifies standard scores. When using this scale, individuals sometimes conflate the values, misunderstanding that a Stanine of 5 is average. Such misconceptions can lead to misguided evaluations of a child’s capabilities.
Another frequent error involves disregarding the importance of the composite score. Users might focus solely on individual subtest performances and miss the larger picture that the composite score provides about overall cognitive ability. Not considering the composite score can misrepresent a student's academic potential.
The misuse of terms within the context of the Bell Curve form also poses challenges. When individuals interchange concepts such as Standard Score (SS) and Standard Deviation (SD), confusion ensues. Clear distinctions must be understood to avoid conflating these vital metrics.
Many individuals neglect to evaluate the direction of a child's scores over time. A child’s percentile rank may continue to drop despite special education interventions, and if this shift is not noticed, it can hinder necessary adjustments in educational strategies.
Failure to apply the correct benchmark ranges represents a significant oversight. Individuals may mistakenly apply percentile ranks or score interpretations without realizing that most tests expect scores within the 25% to 75% range to be considered average. This fundamental error can result in misguided assumptions regarding a child's abilities.
Lastly, individuals often forget to consult the accompanying charts or guidelines thoroughly. The Bell Curve’s rationale extends beyond the numbers; without proper reference to the charts depicting degrees of deviation, the indicated results can be taken out of context. Missing this critical information creates a disconnect in understanding the data presented in the form.
The Bell Curve form is a crucial document for evaluating and interpreting cognitive and academic performance. It provides a standardized framework for understanding where an individual's scores fall in relation to the average. Accompanying this form, several other documents are often utilized in assessments. Each document serves a unique purpose and together they provide a comprehensive picture of the individual's abilities.
By using these documents alongside the Bell Curve form, parents and educators can collaborate more effectively to support a child’s educational journey. Each document provides valuable insights that contribute to a well-rounded understanding of an individual’s needs and abilities.
Standard Score Report: Similar to the Bell Curve form, a standard score report translates raw test scores into a standardized format. This makes it easier to understand how an individual performed relative to a normal distribution.
Percentile Rank Form: Just like the Bell Curve, this form indicates an individual’s performance relative to a defined group. It shows the percentage of people in the group that scored below a given score, providing a clear comparison.
Wechsler IQ Test Report: This document outlines the results from the Wechsler IQ tests, detailing standard scores, percentile ranks, and subtest scores. The format prioritizes clarity regarding where an individual stands compared to peers.
Report Card: A report card summarizes student performance over a period, often using a grading scale. Similarly to the Bell Curve form, it provides insights into how a student performs academically compared to others.
Performance Assessment Summary: This document evaluates a person's skills or knowledge in specific areas. Like the Bell Curve, it often includes scores positioned within a larger context, comparing individual performance to broader metrics.
Educational Evaluation Report: This is similar to the Bell Curve form as it offers a comprehensive look at a student’s abilities and needs, often including standardized scores and percentiles, making data interpretation clear for educators and families.
Norm-Referenced Test Report: This report provides scores from a test that compares individuals to a normative sample. It shares the objective of the Bell Curve form in presenting how a person ranks against a larger group.
When filling out the Bell Curve form, consider the following guidelines. They will help ensure accurate completion and understanding of your child's assessment results.
By following these recommendations, your completion of the Bell Curve form will be more effective and beneficial.
Misconceptions about the Bell Curve form can lead to misunderstandings about how scores and evaluations work. Here are some common misconceptions along with clarifications:
By addressing these misconceptions, parents, educators, and evaluators can ensure a better understanding of the Bell Curve and its implications in educational assessments.
Understand that the Bell Curve form is a tool to assess an individual's performance relative to their peers. It emphasizes how scores relate to the overall distribution of scores.
Your Standard Score, or SS, typically has a mean of 100 and a Standard Deviation, or SD, of 15. This means that most individuals will score near the average.
A score of 115 reflects performance that is one SD above the mean, placing an individual around the 84th percentile. This indicates a higher than average ability level.
It is important to compare scores across different tests. For instance, if a child's IQ is 110 yet their written language score is 87, they are performing below their potential.
Recognize that half of all children score between the 25th and 75th percentiles. This range signifies an average performance level.
Monitor whether a child’s percentile rank improves over time, particularly when they are receiving additional educational support or interventions.
Familiarize yourself with other scoring methods such as Stanine Scores, where a score of 5 represents an average performance. Understanding multiple scoring systems provides a comprehensive view of a child’s abilities.