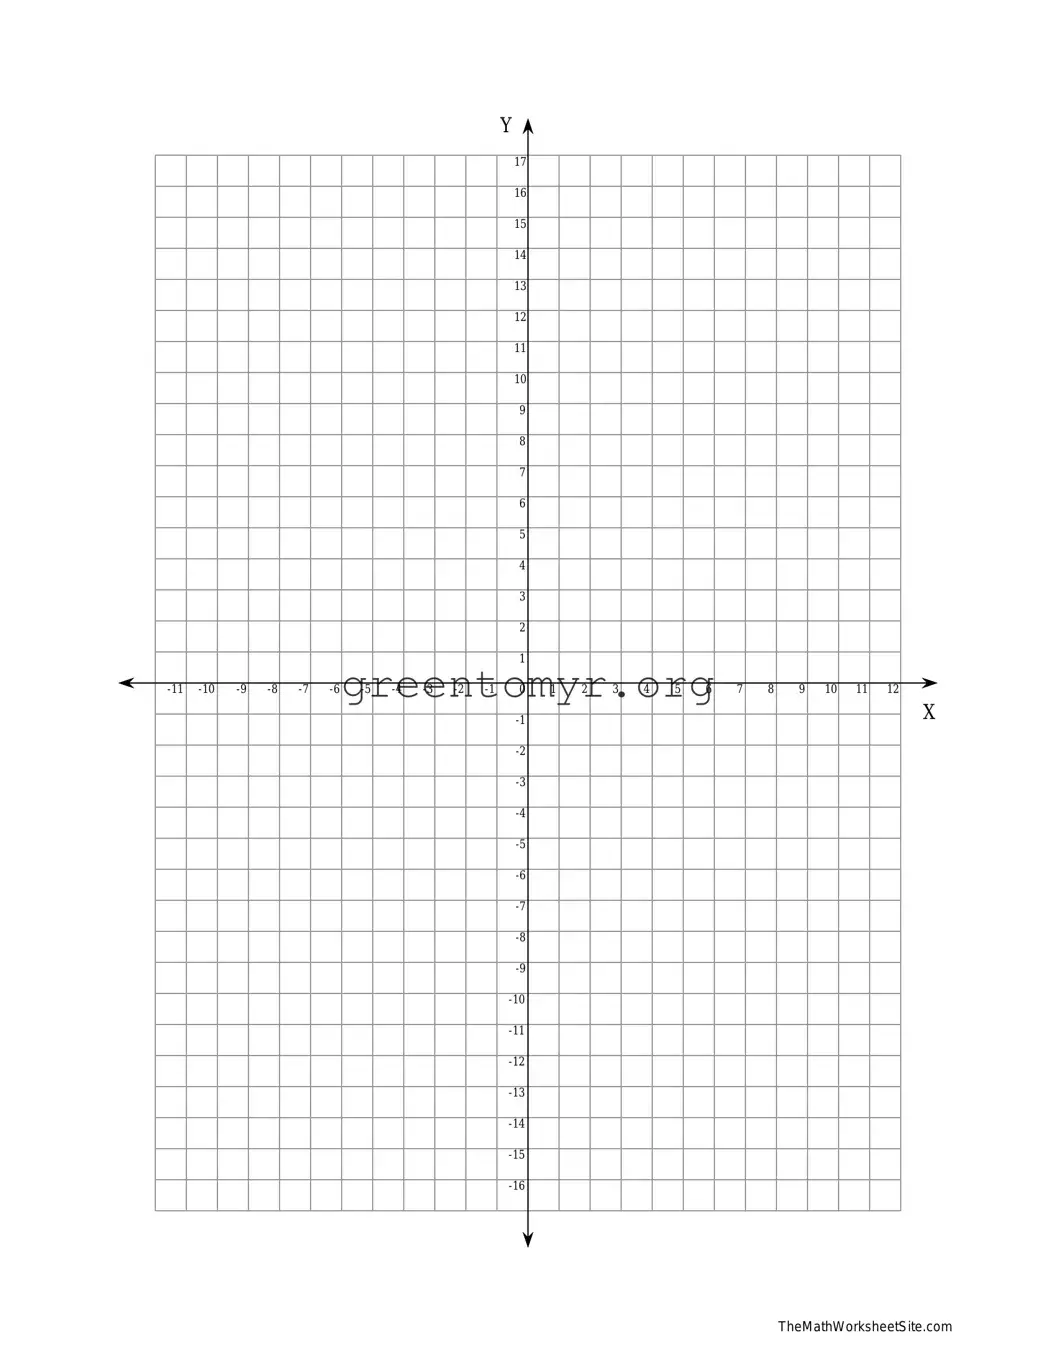
The Coordinate Plane form is an essential tool used in mathematics to represent and analyze relationships between numbers, especially in geometry and algebra. This form utilizes a two-dimensional grid, commonly known as the Cartesian plane, where points are defined by their horizontal and vertical distances from the origin, which is marked as (0,0). In this plane, the x-axis runs horizontally, while the y-axis rises vertically, creating a clear structure for plotting points. Each point's position is articulated through an ordered pair, typically written as (x, y), where 'x' denotes the position along the x-axis and 'y' indicates the position along the y-axis. Understanding how to work with the Coordinate Plane form is vital for solving equations, graphing functions, and interpreting data visually. As you explore this form, you will discover its significance in not only academic settings but also in real-world applications such as computer graphics, navigation, and engineering. Familiarity with the concepts of quadrants, distance between points, and slope will empower you to make the most of the Coordinate Plane, transforming how you visualize mathematical relationships and solve problems effectively.
|
|
|
|
|
|
|
|
|
|
|
Y |
|
|
|
|
|
|
|
|
|
|
|
|
|
|
|
|
|
|
|
|
|
|
|
|
|
|
|
|
|
|
|
|
|
|
|
|
|
|
|
|
|
|
|
|
|
|
|
|
|
|
|
|
|
|
|
|
|
|
|
|
|
|
|
|
|
|
|
|
|
|
|
17 |
|
|
|
|
|
|
|
|
|
|
|
|
|
|
|
|
|
|
|
|
|
|
|
|
|
|
|
|
|
|
|
|
|
|
|
|
|
|
|
|
|
|
|
|
|
|
|
16 |
|
|
|
|
|
|
|
|
|
|
|
|
|
|
|
|
|
|
|
|
|
|
|
|
|
|
|
|
|
|
|
|
|
|
|
|
|
|
|
|
|
|
|
|
|
|
|
15 |
|
|
|
|
|
|
|
|
|
|
|
|
|
|
|
|
|
|
|
|
|
|
|
|
|
|
|
|
|
|
|
|
|
|
|
|
|
|
|
|
|
|
|
|
|
|
|
14 |
|
|
|
|
|
|
|
|
|
|
|
|
|
|
|
|
|
|
|
|
|
|
|
|
|
|
|
|
|
|
|
|
|
|
|
|
|
|
|
|
|
|
|
|
|
|
|
13 |
|
|
|
|
|
|
|
|
|
|
|
|
|
|
|
|
|
|
|
|
|
|
|
|
|
|
|
|
|
|
|
|
|
|
|
|
|
|
|
|
|
|
|
|
|
|
|
12 |
|
|
|
|
|
|
|
|
|
|
|
|
|
|
|
|
|
|
|
|
|
|
|
|
|
|
|
|
|
|
|
|
|
|
|
|
|
|
|
|
|
|
|
|
|
|
|
11 |
|
|
|
|
|
|
|
|
|
|
|
|
|
|
|
|
|
|
|
|
|
|
|
|
|
|
|
|
|
|
|
|
|
|
|
|
|
|
|
|
|
|
|
|
|
|
|
10 |
|
|
|
|
|
|
|
|
|
|
|
|
|
|
|
|
|
|
|
|
|
|
|
|
|
|
|
|
|
|
|
|
|
|
|
|
|
|
|
|
|
|
|
|
|
|
|
9 |
|
|
|
|
|
|
|
|
|
|
|
|
|
|
|
|
|
|
|
|
|
|
|
|
|
|
|
|
|
|
|
|
|
|
|
|
|
|
|
|
|
|
|
|
|
|
|
8 |
|
|
|
|
|
|
|
|
|
|
|
|
|
|
|
|
|
|
|
|
|
|
|
|
|
|
|
|
|
|
|
|
|
|
|
|
|
|
|
|
|
|
|
|
|
|
|
7 |
|
|
|
|
|
|
|
|
|
|
|
|
|
|
|
|
|
|
|
|
|
|
|
|
|
|
|
|
|
|
|
|
|
|
|
|
|
|
|
|
|
|
|
|
|
|
|
6 |
|
|
|
|
|
|
|
|
|
|
|
|
|
|
|
|
|
|
|
|
|
|
|
|
|
|
|
|
|
|
|
|
|
|
|
|
|
|
|
|
|
|
|
|
|
|
|
5 |
|
|
|
|
|
|
|
|
|
|
|
|
|
|
|
|
|
|
|
|
|
|
|
|
|
|
|
|
|
|
|
|
|
|
|
|
|
|
|
|
|
|
|
|
|
|
|
4 |
|
|
|
|
|
|
|
|
|
|
|
|
|
|
|
|
|
|
|
|
|
|
|
|
|
|
|
|
|
|
|
|
|
|
|
|
|
|
|
|
|
|
|
|
|
|
|
3 |
|
|
|
|
|
|
|
|
|
|
|
|
|
|
|
|
|
|
|
|
|
|
|
|
|
|
|
|
|
|
|
|
|
|
|
|
|
|
|
|
|
|
|
|
|
|
|
2 |
|
|
|
|
|
|
|
|
|
|
|
|
|
|
|
|
|
|
|
|
|
|
|
|
|
|
|
|
|
|
|
|
|
|
|
|
|
|
|
|
|
|
|
|
|
|
|
1 |
|
|
|
|
|
|
|
|
|
|
|
|
|
|
|
|
|
|
|
|
|
|
|
|
|
|
|
|
|
|
|
|
|
|
|
|
0 |
1 |
2 |
3 |
4 |
5 |
6 |
7 |
8 |
9 |
10 |
11 |
12 |
|||||||||||
|
|
|
|
|
|
|
|
|
|
|
|
|
|
|
|
|
|
|
|
|
|
|
|
|
|
|
|
|
|
|
|
|
|
|
|
|
|
|
|
|
|
|
|
|
|
|
|
|
|
|
|
|
|
|
|
|
|
|
|
|
|
|
|
|
|
|
|
|
|
|
|
|
|
|
|
|
|
|
|
|
|
|
|
|
|
|
|
|
|
|
|
|
|
|
|
|
|
|
|
|
|
|
|
|
|
|
|
|
|
|
|
|
|
|
|
|
|
|
|
|
|
|
|
|
|
|
|
|
|
|
|
|
|
|
|
|
|
|
|
|
|
|
|
|
|
|
|
|
|
|
|
|
|
|
|
|
|
|
|
|
|
|
|
|
|
|
|
|
|
|
|
|
|
|
|
|
|
|
|
|
|
|
|
|
|
|
|
|
|
|
|
|
|
|
|
|
|
|
|
|
|
|
|
|
|
|
|
|
|
|
|
|
|
|
|
|
|
|
|
|
|
|
|
|
|
|
|
|
|
|
|
|
|
|
|
|
|
|
|
|
|
|
|
|
|
|
|
|
|
|
|
|
|
|
|
|
|
|
|
|
|
|
|
|
|
|
|
|
|
|
|
|
|
|
|
|
|
|
|
|
|
|
|
|
|
|
|
|
|
|
|
|
|
|
|
|
|
|
|
|
|
|
|
|
|
|
|
|
|
|
|
|
|
|
|
|
|
|
|
|
|
|
|
|
|
|
|
|
|
|
|
|
|
|
|
|
|
|
|
|
|
|
|
|
|
|
|
|
|
|
|
|
|
|
|
|
|
|
|
|
|
|
|
|
|
|
|
|
|
|
|
|
|
|
|
|
|
|
|
|
|
|
|
|
|
|
|
|
|
|
|
|
|
|
|
|
|
|
|
|
|
|
|
|
|
|
|
|
|
|
|
|
|
|
|
|
|
|
|
|
|
|
|
|
|
|
|
|
|
|
|
|
|
|
|
|
|
|
|
|
|
|
|
|
|
|
|
|
|
|
|
|
|
|
|
|
|
|
|
|
|
|
|
|
|
|
|
|
|
|
|
|
|
|
|
|
|
|
|
|
|
|
|
|
|
|
|
|
|
|
|
|
|
|
|
|
|
|
|
|
|
|
|
|
|
|
|
|
|
|
|
|
|
|
|
|
|
|
|
|
|
|
|
|
|
|
|
|
|
|
|
|
|
|
|
|
|
|
|
|
|
|
|
|
|
|
|
|
|
|
|
|
|
|
|
|
|
|
|
|
|
|
|
|
|
|
|
|
|
|
|
|
|
|
|
|
|
|
|
|
|
|
|
|
|
|
|
|
|
|
|
|
|
|
|
|
|
|
|
|
|
|
|
|
|
|
|
|
|
|
|
|
|
|
|
|
|
|
|
|
|
|
|
|
|
|
|
|
|
|
|
|
|
|
|
|
|
|
|
|
|
|
|
|
|
|
|
|
|
|
|
|
|
|
|
|
|
|
|
|
|
|
|
|
|
|
|
|
|
|
|
|
|
|
|
|
|
|
|
|
|
|
|
|
|
|
|
|
|
|
|
|
|
|
|
|
|
|
|
|
|
|
|
|
|
|
|
|
|
|
|
|
|
|
|
|
|
|
|
|
|
|
|
|
|
|
|
|
|
|
|
|
|
|
|
|
|
|
|
|
|
|
|
|
|
|
|
|
|
|
|
|
|
|
|
|
|
|
|
|
|
|
|
|
|
|
|
|
|
|
|
|
|
|
|
|
|
|
|
|
|
|
|
|
|
|
|
|
|
|
|
|
|
|
|
|
|
|
|
|
|
|
|
|
|
|
|
|
|
|
|
|
|
|
|
X
TheMathWorksheetSite.com
| Fact Name | Details |
|---|---|
| Definition | The coordinate plane form represents a mathematical way to graphically describe a point in two dimensions using a system of axes. |
| Axes | The coordinate plane consists of two perpendicular lines called axes: the x-axis (horizontal) and the y-axis (vertical). |
| Origin | The point where the x-axis and y-axis intersect is known as the origin, located at the coordinates (0,0). |
| Quadrants | The coordinate plane is divided into four quadrants, labeled as Quadrant I, II, III, and IV, based on the signs of the x and y coordinates. |
| Ordered Pairs | Each point in the coordinate plane is described by an ordered pair (x, y), where 'x' represents the horizontal position and 'y' the vertical position. |
| Plotting Points | To plot a point, start at the origin, move horizontally to the x-coordinate, and then move vertically to the y-coordinate. |
| Distance Formula | The distance between any two points (x1, y1) and (x2, y2) in the coordinate plane can be calculated using the formula: √((x2 - x1)² + (y2 - y1)²). |
| Equation of a Line | In coordinate plane form, the equation of a straight line can be expressed as y = mx + b, where 'm' is the slope and 'b' is the y-intercept. |
Before proceeding to fill out the Coordinate Plane form, ensure that you have all relevant information readily available. This information is necessary to accurately represent data on the coordinate system. Follow the steps outlined below to complete the form correctly.
The coordinate plane is a two-dimensional surface where points are defined by pairs of numerical coordinates. Each point has an x-coordinate and a y-coordinate, which indicate its position relative to two perpendicular lines called axes. The horizontal axis is known as the x-axis, while the vertical axis is the y-axis. Together, these axes divide the plane into four quadrants.
The coordinate plane is divided into four quadrants:
Points are represented as ordered pairs in the format (x, y), where 'x' denotes the horizontal position and 'y' denotes the vertical position. For example, the point (3, 2) indicates a position three units to the right of the origin and two units up.
The origin is the point of intersection of the x-axis and y-axis. It is represented by the ordered pair (0, 0). The origin serves as a reference point for locating all other points in the coordinate plane.
To plot a point, follow these steps:
The distance formula calculates the distance between two points (x₁, y₁) and (x₂, y₂) in the coordinate plane. It is given by the equation: √((x₂ - x₁)² + (y₂ - y₁)²). This formula arises from the Pythagorean theorem.
Two or more points are collinear if they lie on the same straight line. To determine if points are collinear, one can either graph them or use the slope formula to compare the slopes between pairs of points.
Slope refers to the steepness of a line on the coordinate plane and is calculated as the change in y divided by the change in x between two points. The formula is: slope (m) = (y₂ - y₁) / (x₂ - x₁). A positive slope indicates a rise, while a negative slope indicates a decline.
Linear equations represent straight lines in the coordinate plane. They can be represented in various forms, including slope-intercept form (y = mx + b), where 'm' is the slope and 'b' is the y-intercept. The solutions to a linear equation correspond to the coordinates of points that lie on that line.
The coordinate plane is essential in various fields, including engineering, architecture, and computer graphics. It aids in visualizing and solving problems related to space and movement. For instance, GPS technology relies on coordinate systems to pinpoint locations accurately.
Filling out the Coordinate Plane form can seem straightforward, but many people make common mistakes that can lead to confusion or errors in data interpretation. One frequent error is incorrect labeling of axes. Participants should always ensure that the x-axis and y-axis are clearly marked. Missing or unclear labels can make it difficult to understand the data's context.
Another common mistake involves scaling issues. Users often forget to apply a consistent scale across both axes. Inconsistent scales can distort the visual representation of data, leading to misinterpretations. Always double-check that the units are evenly spaced, which helps maintain clarity.
Inaccurate plotting of points is also a significant error. Some individuals mistakenly place points in the wrong quadrant or at inaccurate coordinates. It's crucial to take a moment to verify each point's position before finalizing the form to avoid future complications.
In some cases, people fail to include necessary data. Missing points can skew the results and prevent accurate analysis. Ensure that all required coordinates are filled in, as incomplete forms may not provide a full picture of the intended message.
Additionally, participants sometimes overlook the importance of showing units. Not specifying units can lead to misunderstandings when interpreting the data. Always include clear unit descriptions to provide context for the numbers presented.
Another mistake involves not providing a legend when multiple data sets are plotted on the same graph. This oversight can lead to confusion about which points correspond to which data set. Including a legend improves clarity and helps anyone looking at the form understand the data appropriately.
Some individuals might rely too heavily on digital tools for plotting, potentially misrepresenting their data due to software limitations. Always cross-check digital plots manually to ensure accuracy. Software tools can be helpful, but verification is key.
A lack of thorough review prior to submission can result in several errors being overlooked. Taking the time to review the entire form can catch simple mistakes that would otherwise lead to confusion or miscommunication down the line.
Lastly, failing to adhere to submission guidelines is a mistake many make. Each form may have specific requirements for submission. Ignoring these guidelines can cause delays or prevent the form from being accepted. Always read the instructions carefully to ensure compliance.
The Coordinate Plane form is essential for various applications, particularly in fields like education, engineering, and design. It is often used in conjunction with other documents that help to clarify, validate, or visualize data and concepts. Here are some common forms and documents that complement the use of the Coordinate Plane form:
Using these additional documents alongside the Coordinate Plane form enhances understanding and application. Together, they provide a comprehensive approach to working with coordinates and graphical representations.
When filling out the Coordinate Plane form, it's important to proceed with care. Here are some guidelines to follow:
Conversely, here are some common mistakes to avoid:
Understanding the Coordinate Plane can be tricky. Let's explore ten common misconceptions people have about it.
By clarifying these misconceptions, one can better understand how to work with the Coordinate Plane and appreciate its full capabilities.
Understanding the Coordinate Plane form can greatly enhance your ability to work with graphing data. Here are some key takeaways to keep in mind: